
The Analytics Module's Landing Page
When you open Extensiv Order Manager's Analytics module, you will notice important information about your account displayed right on the Analytics landing page.
Please keep in mind most of the information on this page will not be accurate until your vendor costs are in the system.
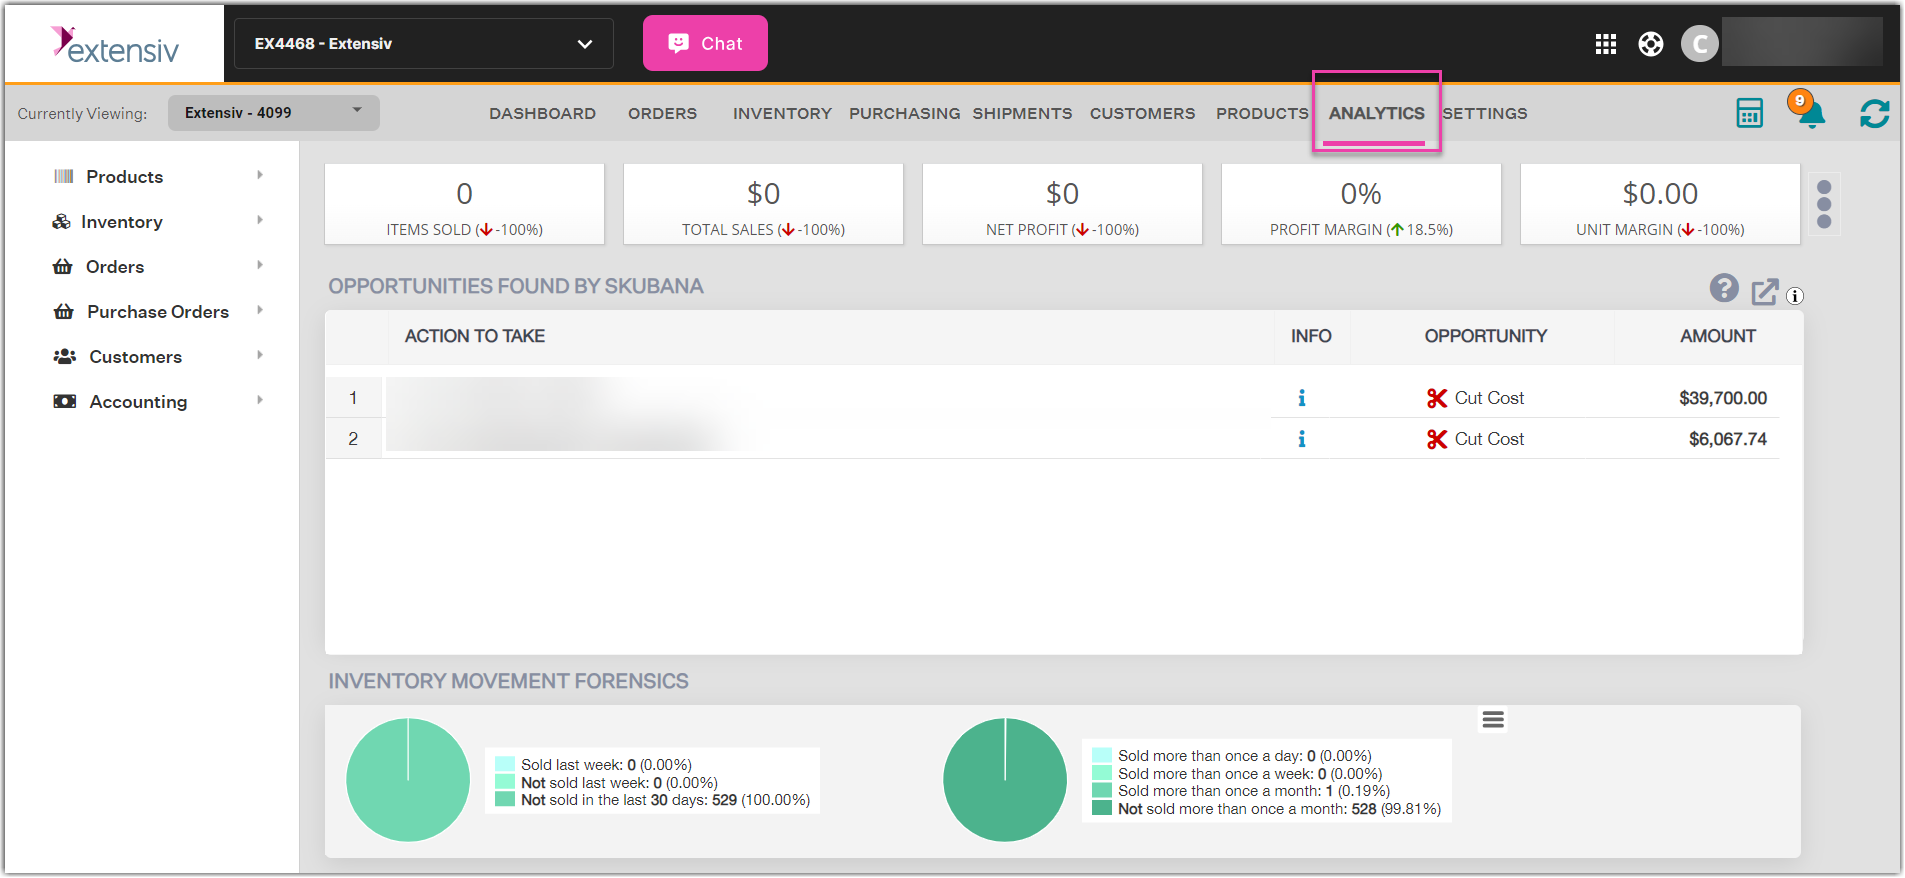
At the top, you will see summary information about your account's performance in terms of items sold, total sales, net profit earned, as well as your profit and unit margins.
Opportunities Found by Extensiv Order Manager
Immediately below the summary is the Opportunities Found by Extensiv Order Manager, which identifies, as the name implies, opportunities for improving your company's bottom line. You can find more information about this report here.
Inventory Movement Forensics
On the left-bottom side of the landing page is the Inventory Movement Forensics chart, which summarizes your inventory movement for the week, month and the selected date range. The chart shows the number and percentage of the following:
- Products which sold in the last week
- Products which have not sold in the last week
- Products which have not sold over the selected date range
- Products which have sold more than once a day
- Products which have sold more than once a week
- Products which have sold more than once a month
- Products which have not sold for more than a month
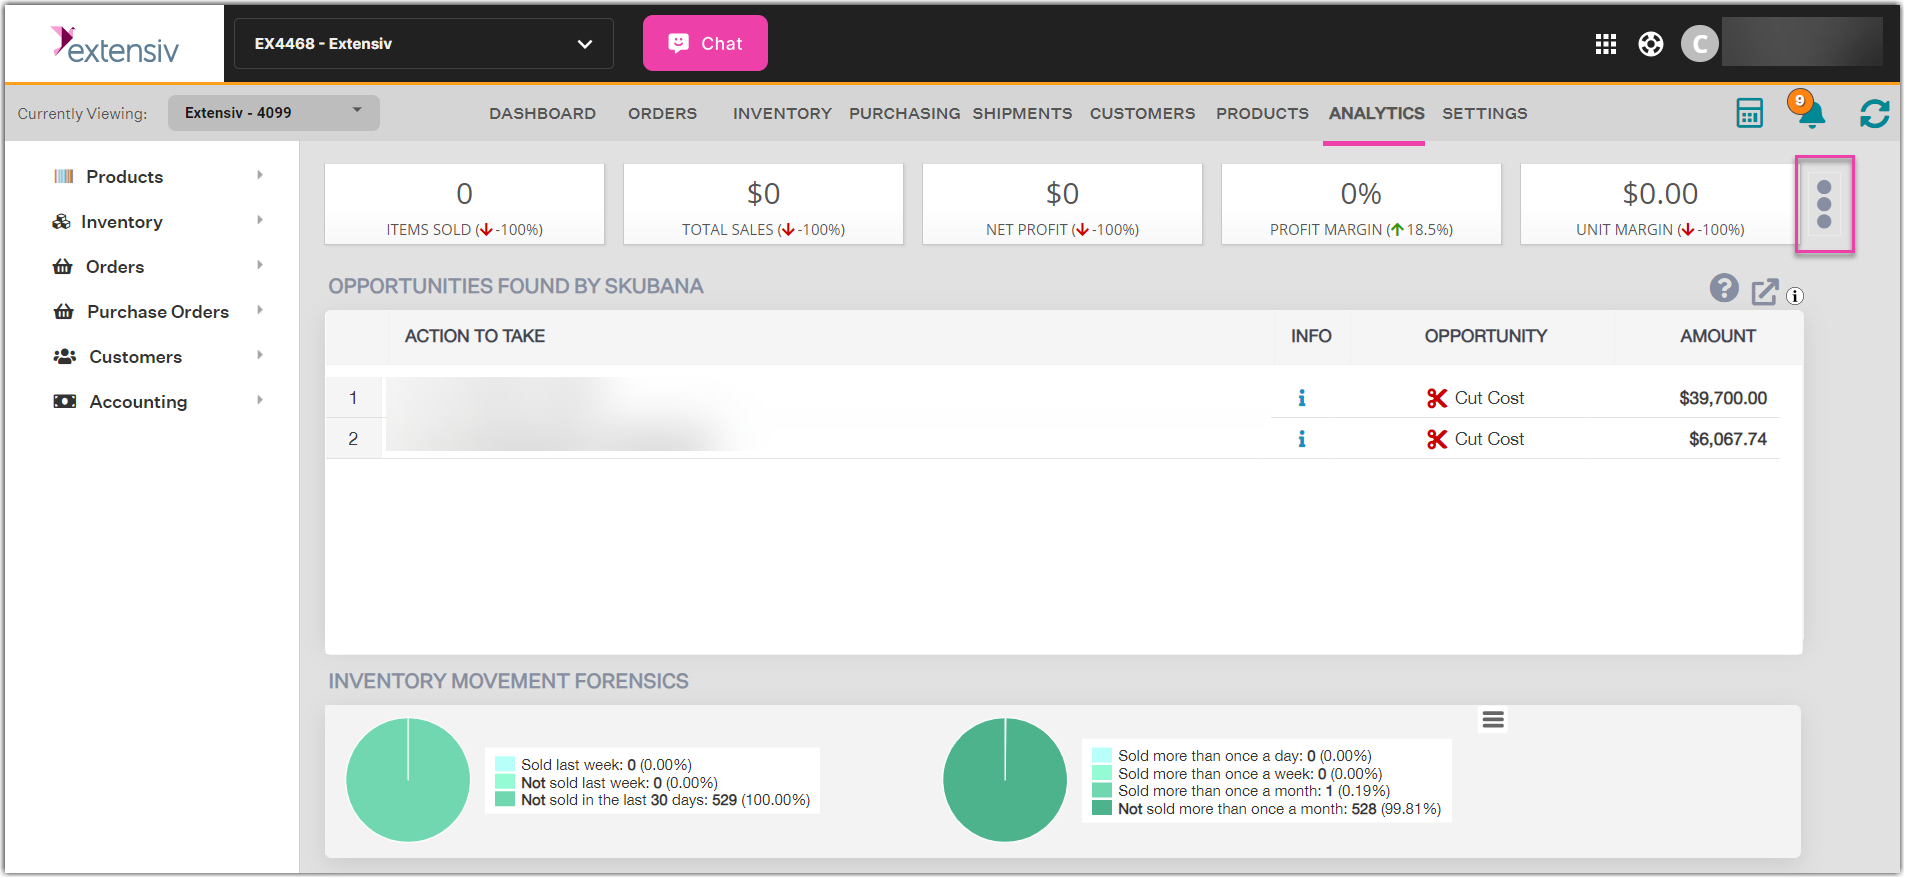
Changing the Date Range for the Displayed Information
By default, the information displayed is for the last 30 days. To see your account's performance for the past 60 and 90 days, respectively, click the icon to the right, then select the appropriate option.
When using Extensiv Order Manager, click the ? icon at the top-right of any report, when available, to display the online help item related to the report.